The mobile app ecosystem is growing so quickly – exponentially, even – that sometimes it’s hard to see the larger trends occurring in the space. To really gain insight, it helps to look back over a longer period of time, like a year for example, in order to take stock of the changes taking place.
To that end, I reached out to mobile app search company Chomp, who kindly obligated my curiousity by packaging together its first ever annual app search analytics report. The report digs into the data from Chomp’s 1 million app searches per month, to reveal trends in app prices, category share, top apps and more.
Note: The data below is conclusive for 2011, but Chomp’s Android app was only released in February. Chomp felt the graphs looked better starting from May, when data stabilized on both platforms.
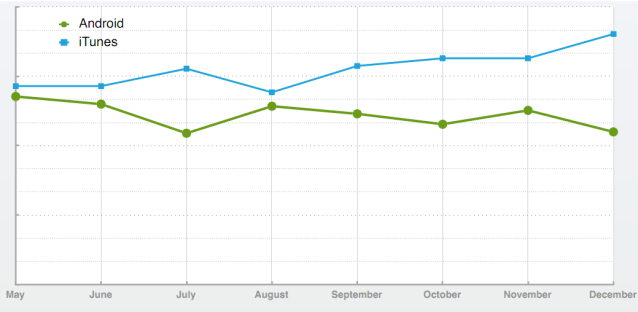
To begin, Chomp took a deep dive in category share trends. The very first finding was a bit surprising. Chomp found that games are now seeing a decreasing number of downloads on Android. That’s interesting because we’ve come to think of the mobile gaming market as this booming space, which is defining itself as the top category driving mobile app download growth. But, based on Chomp’s data at least, this is only true for iOS. Over the course of the year, games became an increasingly large percentage of iTunes downloads, but have been decreasing on Android.
In December, for example, games were 36.1% of iTunes downloads and 22% of Android downloads.
So if not games, what’s growing in popularity on Android? I would have guessed Utilities but would have been wrong. It’s Entertainment apps. This includes apps like Netflix, Talking Tom, Crackle and Flixster, to give you an idea.

Meanwhile, on iTunes, music and fitness apps have been seeing increased popularity, and utilities are decreasing. Again, this goes contrary to popular belief that normal users (the non-technical/non-early adopters) are looking for more mobile tools – things that help them get a specific task done. Clearly, they’re also enjoying apps Spotify, Mog, RunKeeper and Nike Fitness, too.

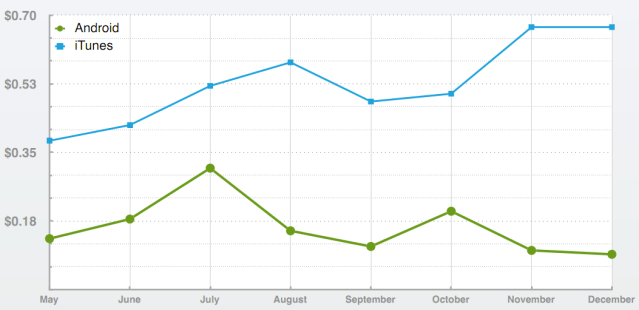
In terms of app pricing, iTunes has seen purchase prices rise by 50% while Android prices have dropped. During December, the average iTunes app purchase price was $0.67 while the average Android app purchase price was only $0.09.

But here’s another interesting twist: the average purchase price for just paid apps is higher on Android ($3.17) than on iTunes ($2.41). This is due to iTunes’ large number of $0.99 downloads, however, which throw off the average.
It also has to be noted that Android sees a really low number of paid downloads (5%) compared with iTunes (22%), according to Chomp.

Finally, Chomp revealed its top 10 iTunes and Android apps of the year. These are different lists than what the app store itself would show, as they’re based on Chomp’s searches, not raw download numbers.
On Android, the top apps were:
On iOS, there’s definitely more focus on having fun, with three versions of Angry Birds, music and photo apps, and Netflix, making the cut. The only remotely “utility-like” app on iOS’s like would be Dropbox.
Overall, the most interesting thing about this report was how it helped reframe some common misconceptions – that Android users only like utilities, for instance, or how cheap the paid Android apps are. They may be few and far between, but they’re not necessarily cheap.
Chomp’s full report includes its own Staff Picks section and a look into Chomp’s traffic search trends, too. (Contact the company if you’re in need of a copy). And may I just say: more data like this, please.
Source:http://techcrunch.com/2012/01/29/games-decreasing-in-popularity-on-android-entertainment-apps-on-the-rise/
To that end, I reached out to mobile app search company Chomp, who kindly obligated my curiousity by packaging together its first ever annual app search analytics report. The report digs into the data from Chomp’s 1 million app searches per month, to reveal trends in app prices, category share, top apps and more.
Note: The data below is conclusive for 2011, but Chomp’s Android app was only released in February. Chomp felt the graphs looked better starting from May, when data stabilized on both platforms.
To begin, Chomp took a deep dive in category share trends. The very first finding was a bit surprising. Chomp found that games are now seeing a decreasing number of downloads on Android. That’s interesting because we’ve come to think of the mobile gaming market as this booming space, which is defining itself as the top category driving mobile app download growth. But, based on Chomp’s data at least, this is only true for iOS. Over the course of the year, games became an increasingly large percentage of iTunes downloads, but have been decreasing on Android.
In December, for example, games were 36.1% of iTunes downloads and 22% of Android downloads.
So if not games, what’s growing in popularity on Android? I would have guessed Utilities but would have been wrong. It’s Entertainment apps. This includes apps like Netflix, Talking Tom, Crackle and Flixster, to give you an idea.

Meanwhile, on iTunes, music and fitness apps have been seeing increased popularity, and utilities are decreasing. Again, this goes contrary to popular belief that normal users (the non-technical/non-early adopters) are looking for more mobile tools – things that help them get a specific task done. Clearly, they’re also enjoying apps Spotify, Mog, RunKeeper and Nike Fitness, too.

In terms of app pricing, iTunes has seen purchase prices rise by 50% while Android prices have dropped. During December, the average iTunes app purchase price was $0.67 while the average Android app purchase price was only $0.09.

But here’s another interesting twist: the average purchase price for just paid apps is higher on Android ($3.17) than on iTunes ($2.41). This is due to iTunes’ large number of $0.99 downloads, however, which throw off the average.
It also has to be noted that Android sees a really low number of paid downloads (5%) compared with iTunes (22%), according to Chomp.

Finally, Chomp revealed its top 10 iTunes and Android apps of the year. These are different lists than what the app store itself would show, as they’re based on Chomp’s searches, not raw download numbers.
On Android, the top apps were:
- Pandora
- Lookout Mobile Security
- Zedge Ringtones
- Advanced Task Killer
- Handcent SMS
- Dolphin Browser
- The Weather Channel
- TuneIn
- GasBuddy
- Angry Birds
- Dropbox
- IMDb
- Pandora
- Angry Birds Seasons
- SoundHound
- Netflix
- Angry Birds Rio
- Instagram (also Apple’s pick for “app of the year”)
On iOS, there’s definitely more focus on having fun, with three versions of Angry Birds, music and photo apps, and Netflix, making the cut. The only remotely “utility-like” app on iOS’s like would be Dropbox.
Overall, the most interesting thing about this report was how it helped reframe some common misconceptions – that Android users only like utilities, for instance, or how cheap the paid Android apps are. They may be few and far between, but they’re not necessarily cheap.
Chomp’s full report includes its own Staff Picks section and a look into Chomp’s traffic search trends, too. (Contact the company if you’re in need of a copy). And may I just say: more data like this, please.
Source:http://techcrunch.com/2012/01/29/games-decreasing-in-popularity-on-android-entertainment-apps-on-the-rise/

No comments:
Post a Comment